Stop Managing Your Operation
by Feel. Manage it by Data.
Most logistics operations are flying blind. You know something is wrong when costs spike or customers complain — but by then, the damage is done. Fleetbase's analytics layer captures every operational data point — deliveries, routes, driver behaviour, fuel, costs, SLAs — and surfaces the insights that let you fix problems before they become expensive, and prove performance to your clients and leadership.
The old way
Managing logistics without data costs you in every direction
Analytics built for logistics operators, not data scientists
Every operational metric, visible in real time, without building a data pipeline.
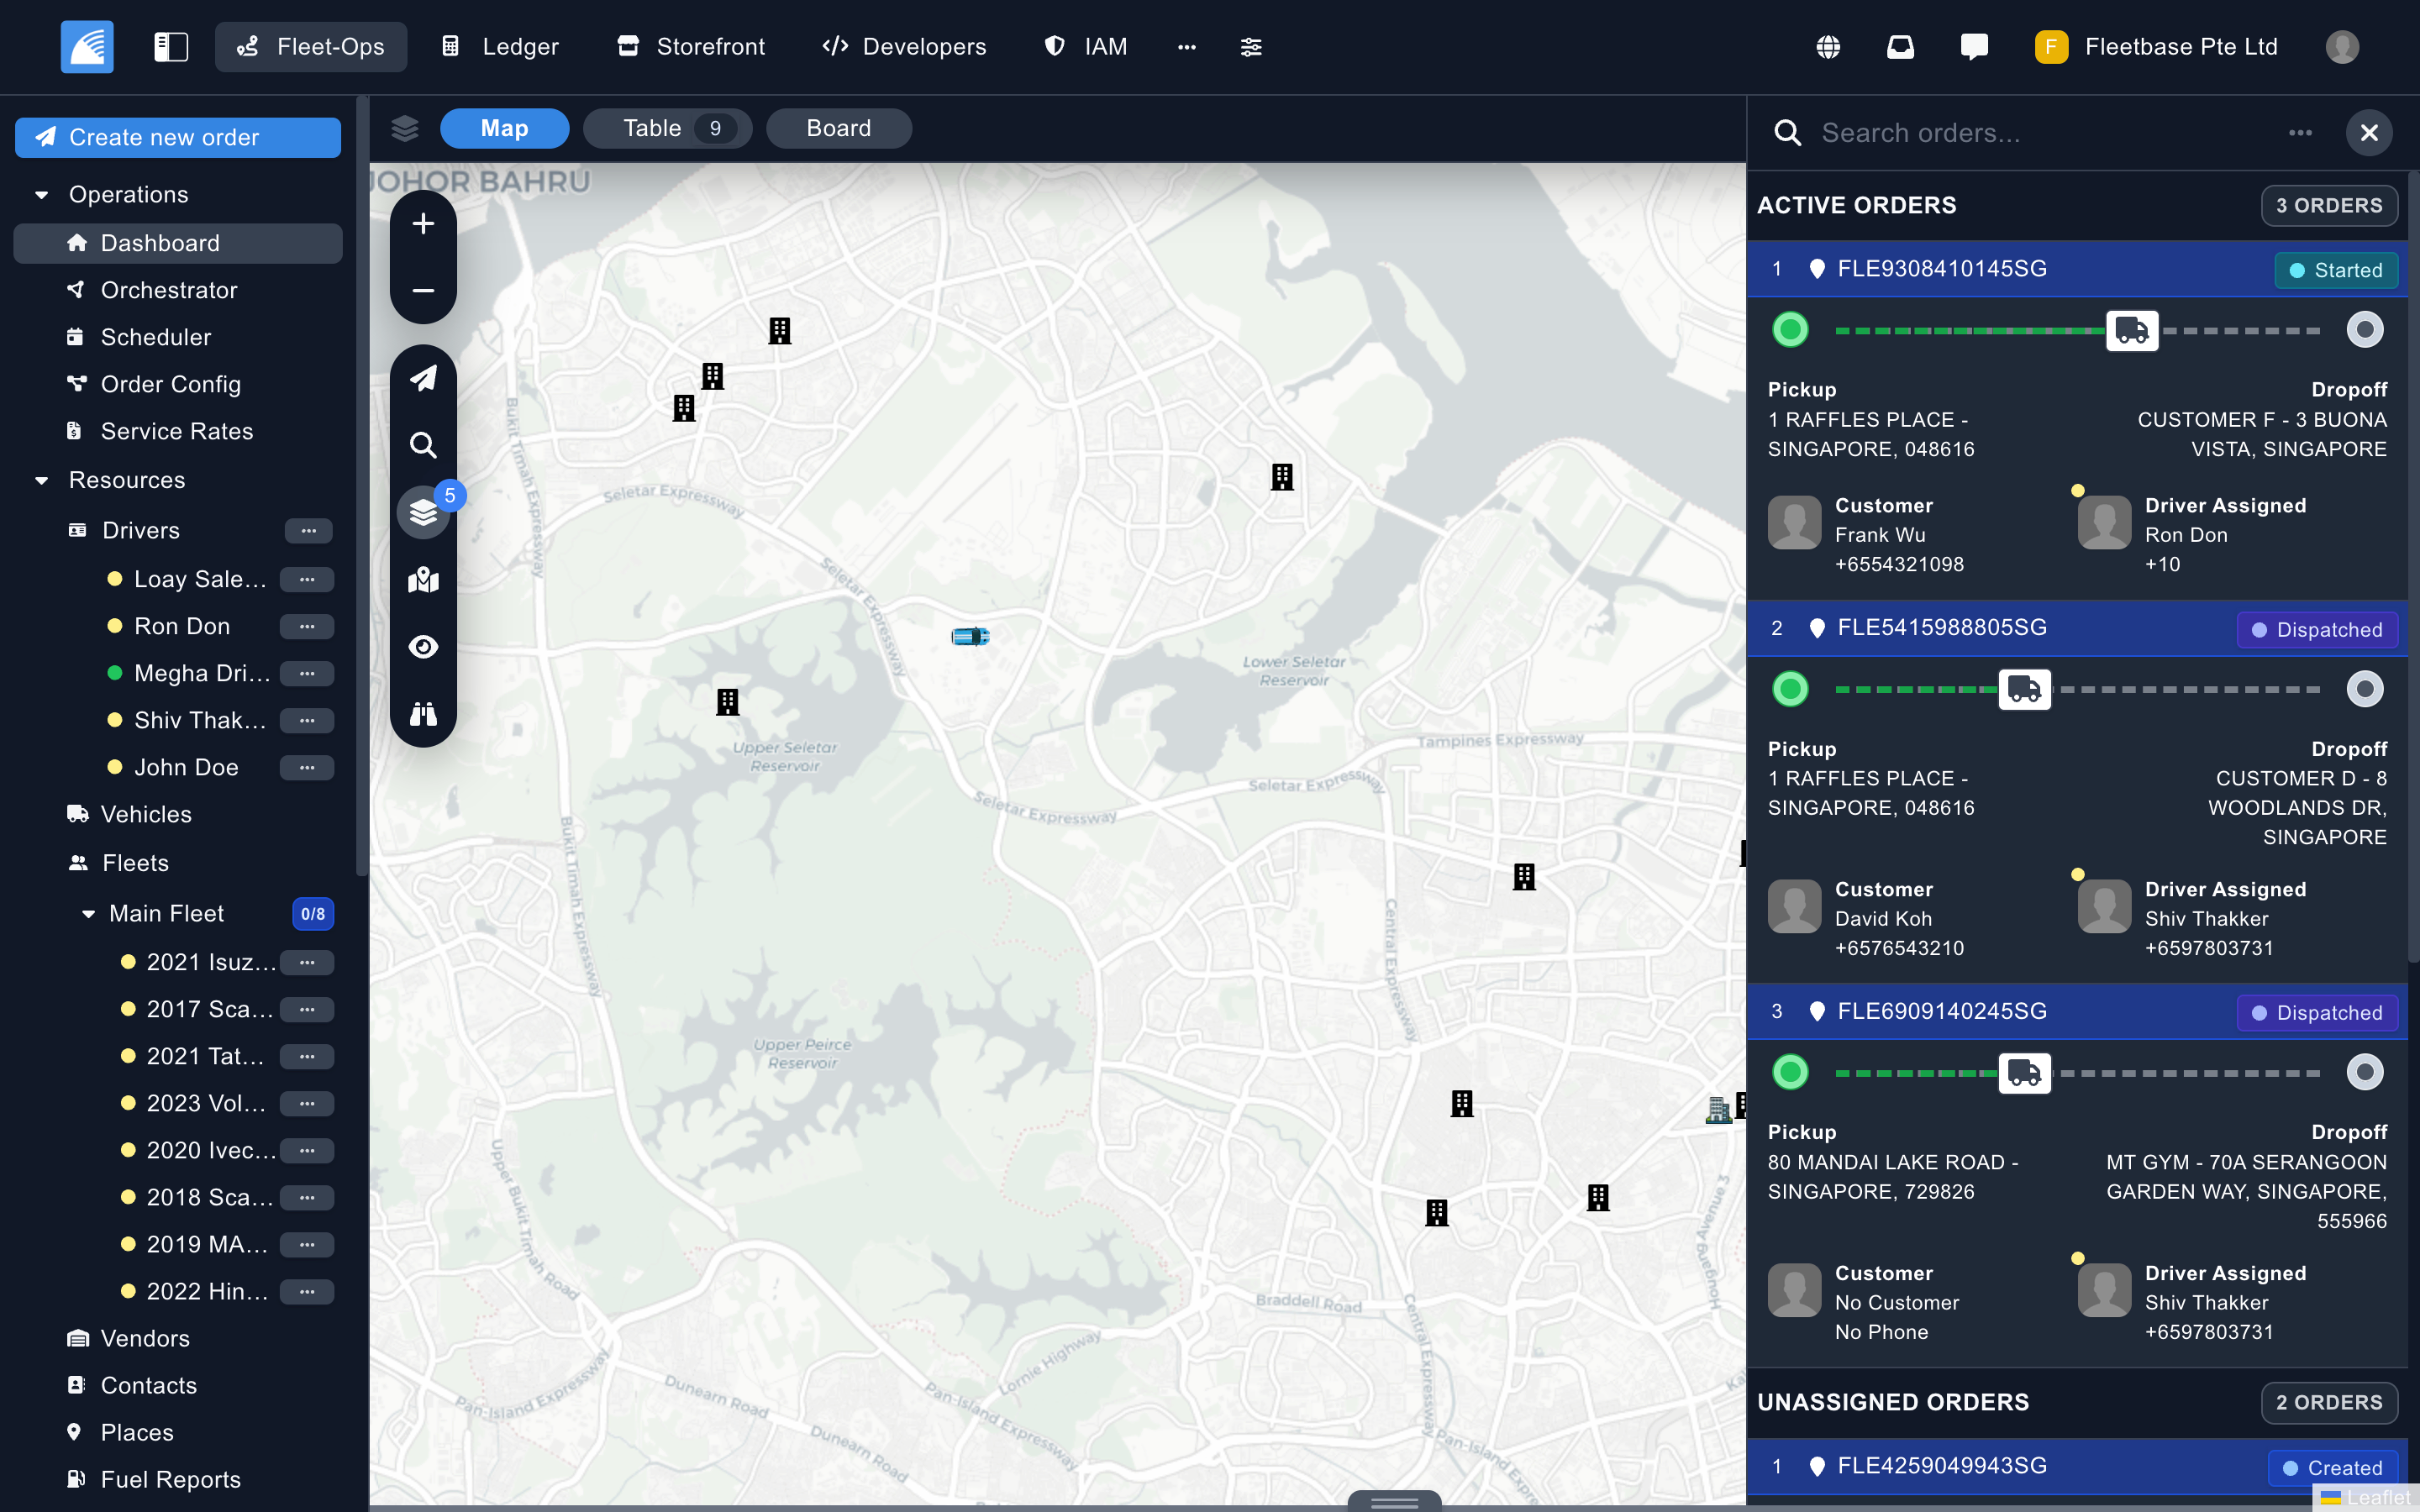
Live Operations Dashboard
The moment you open Fleetbase, you see the current state of your operation — active deliveries, at-risk orders, driver status, and today's performance against targets. No lag, no refresh. The data is live because your operation doesn't pause for reports.
- Real-time active delivery status, driver positions, and order pipeline
- Today's on-time rate, completion rate, and SLA breach count at a glance
- Configurable dashboard widgets for the KPIs your role cares about
Delivery Performance KPIs
Track the metrics that determine whether your delivery operation is meeting commitments: first-attempt delivery rate, on-time percentage, average delivery duration, and SLA adherence — broken down by zone, customer, driver, and time period.
- On-time delivery rate vs. committed windows by zone and customer
- First-attempt delivery rate with failed delivery reason breakdown
- Average delivery duration trending and period-over-period comparison
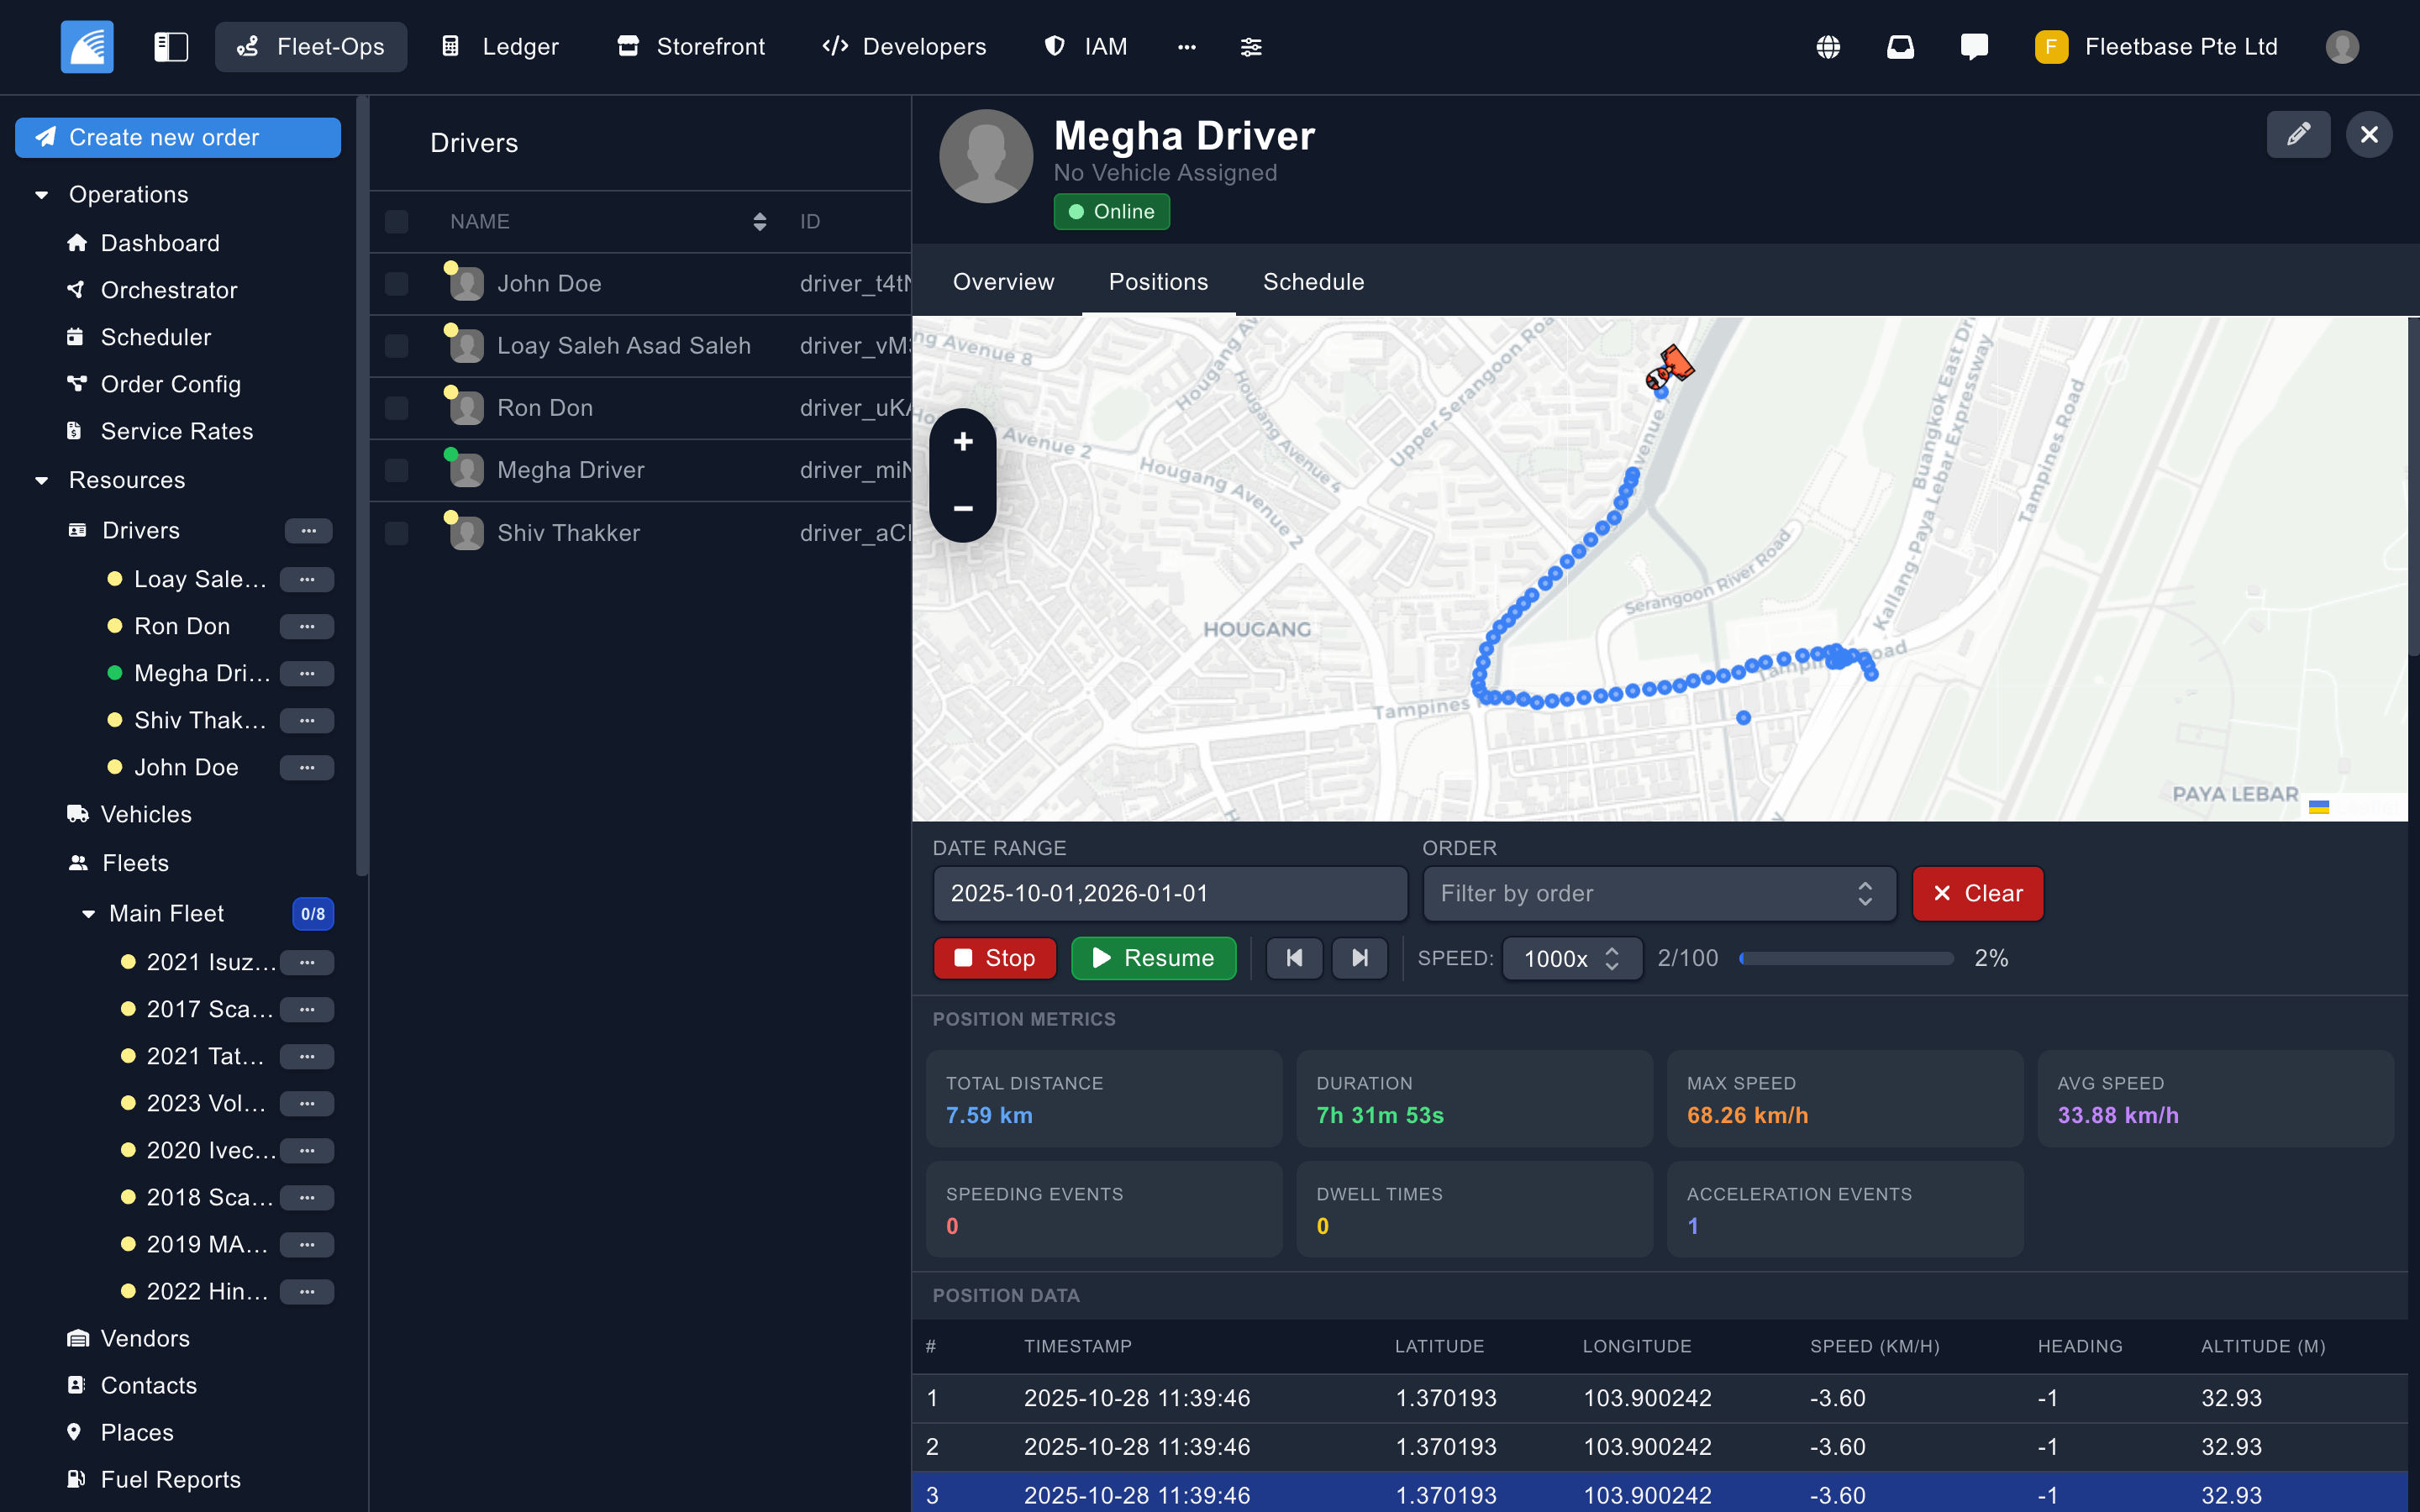
Fleet & Driver Performance Analytics
Understand exactly what's happening at the vehicle and driver level. Identify your top performers, catch underperformance early, and make data-driven decisions on driver training, route assignments, and fleet expansion.
- Driver scorecards: on-time %, POD rate, stops per shift, idle time
- Vehicle utilization rate and cost-per-kilometre by vehicle
- Speeding, harsh braking, and behaviour incident trending per driver
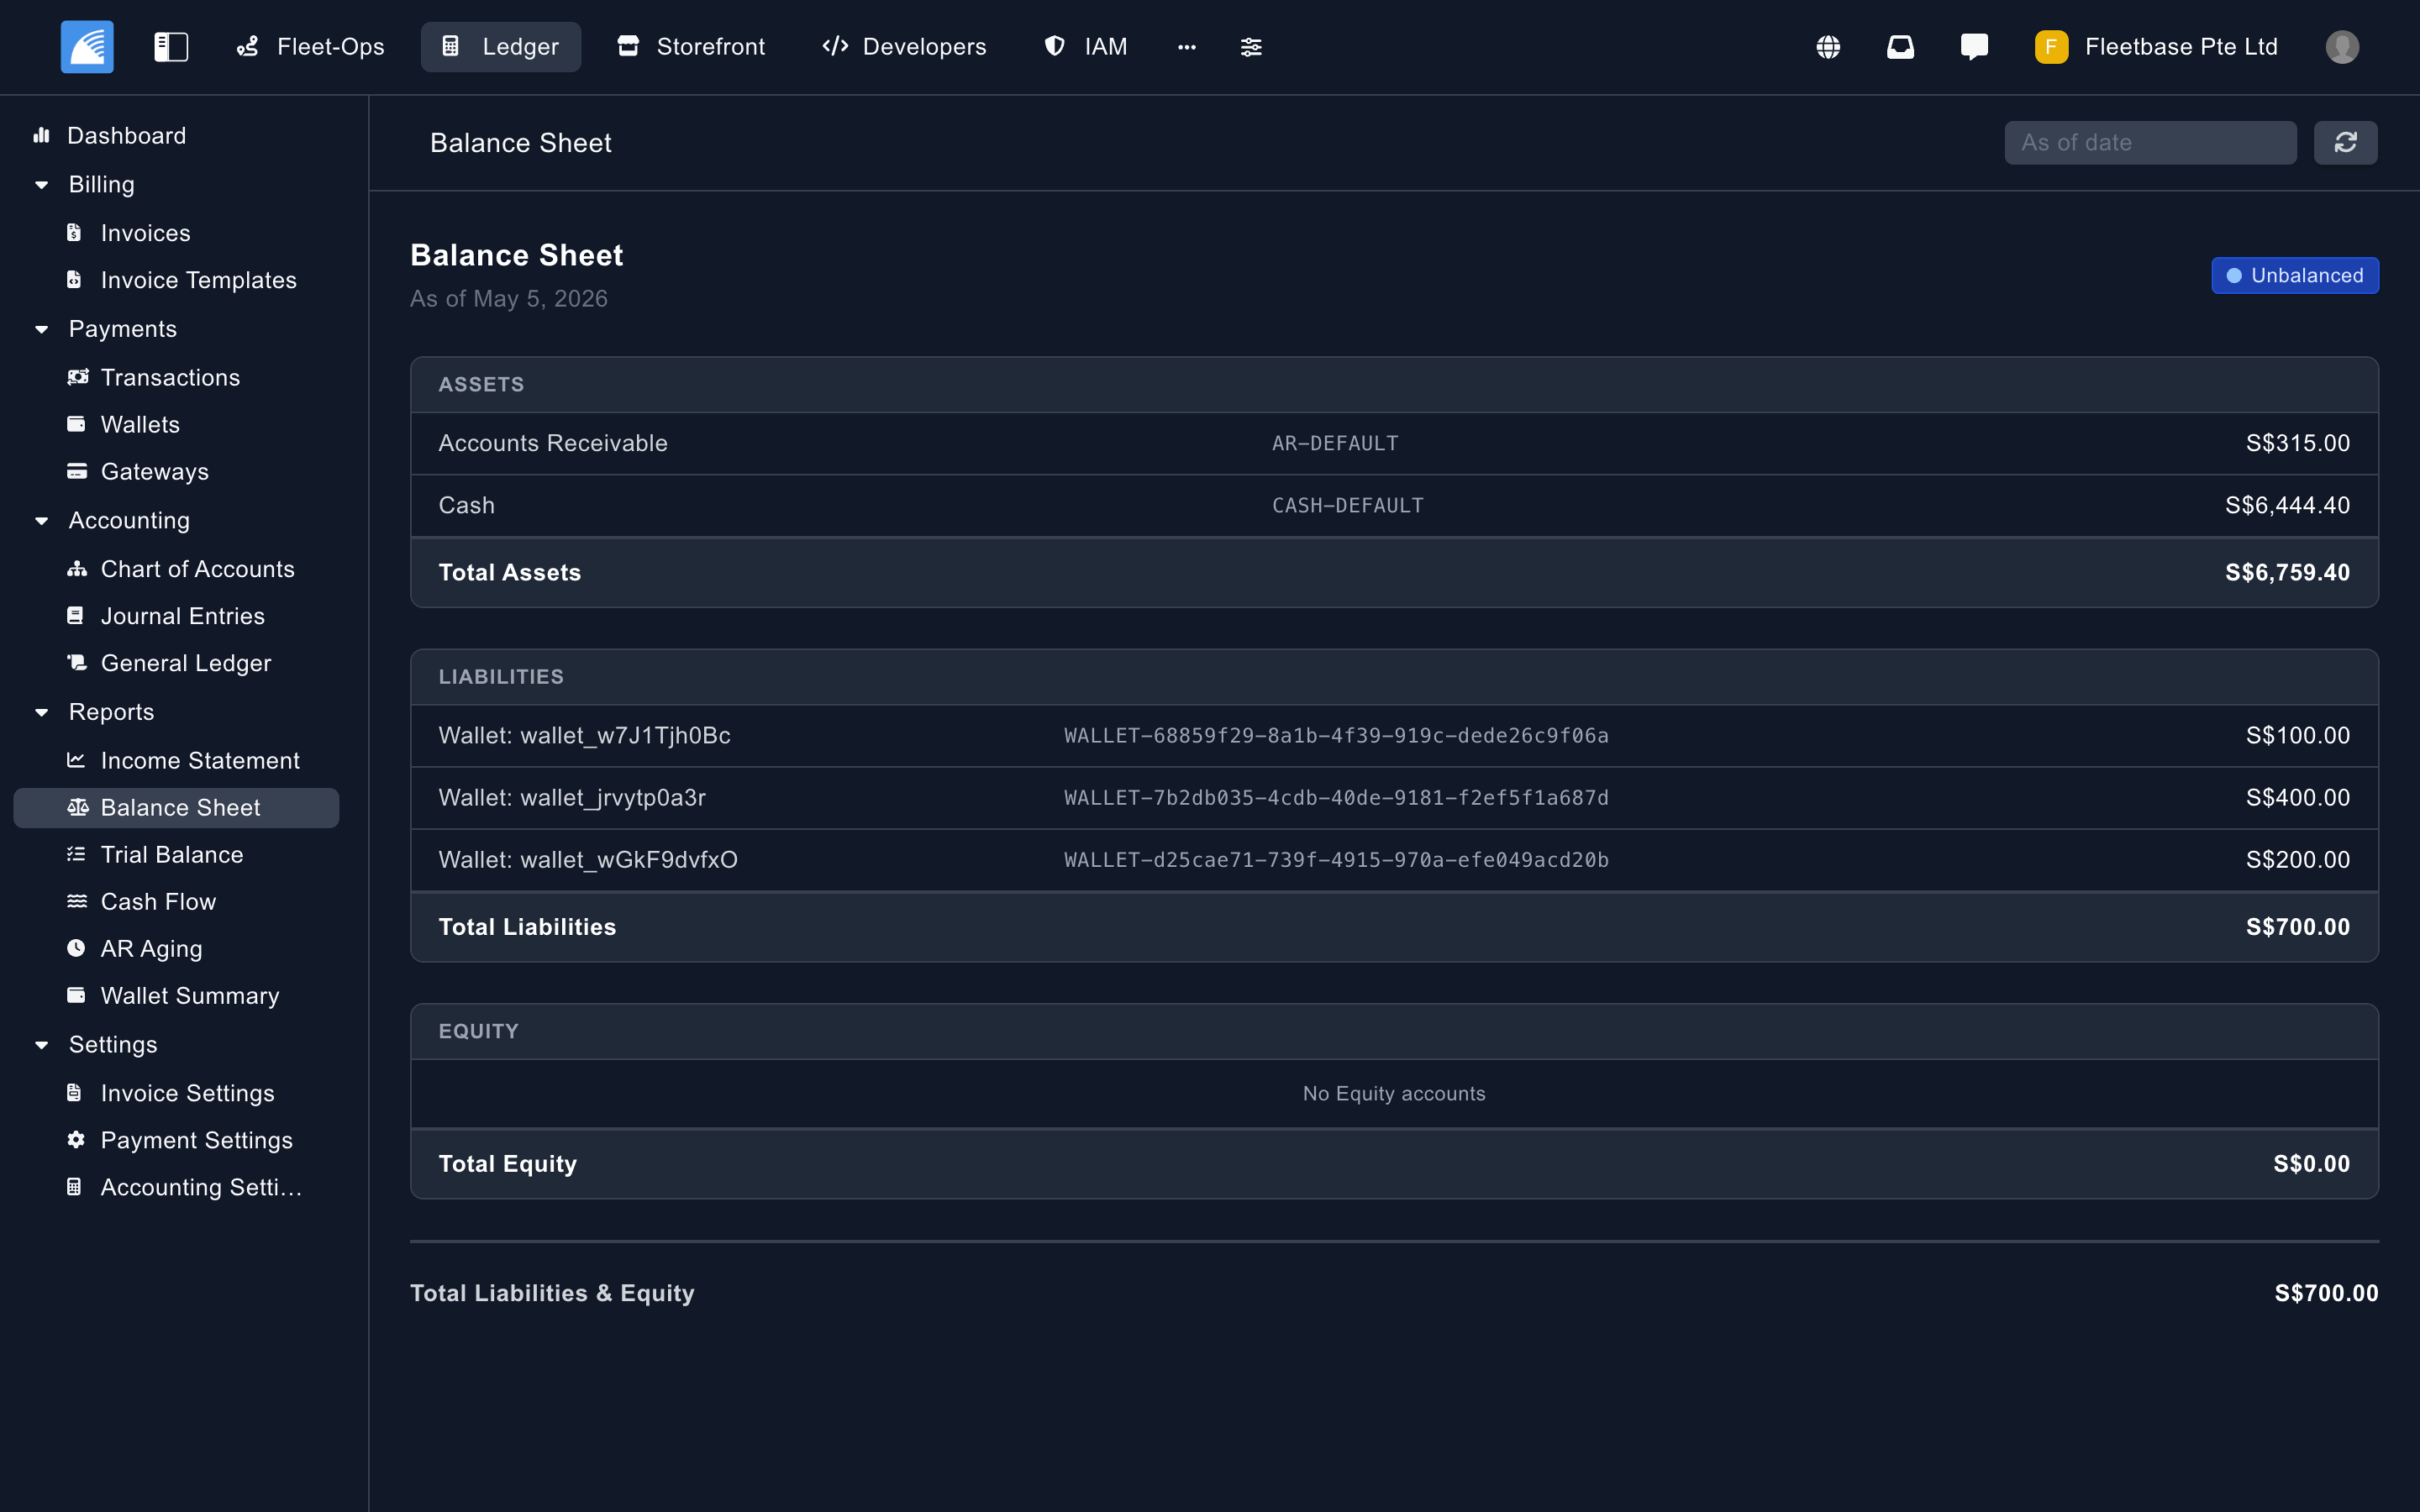
Cost Analysis & Profitability Reporting
Know exactly what every delivery, route, and customer account costs your operation. Track fuel cost per route, cost-per-delivery by zone, and overall margin by service type — so pricing decisions are based on real numbers, not estimates.
- Cost-per-delivery broken down by route, zone, and vehicle type
- Fuel cost variance tracking against optimized plan benchmarks
- Customer account profitability reporting for commercial reviews
SLA & Compliance Reporting
Generate the reports your clients and regulators need — automatically, from your operational data. SLA performance summaries, delivery audit records, compliance certificates, and custom-format reports on a schedule you define.
- Client SLA report generation — scheduled or on-demand
- Compliance report templates for regulatory submissions
- Exportable delivery records in CSV, PDF, and API formats
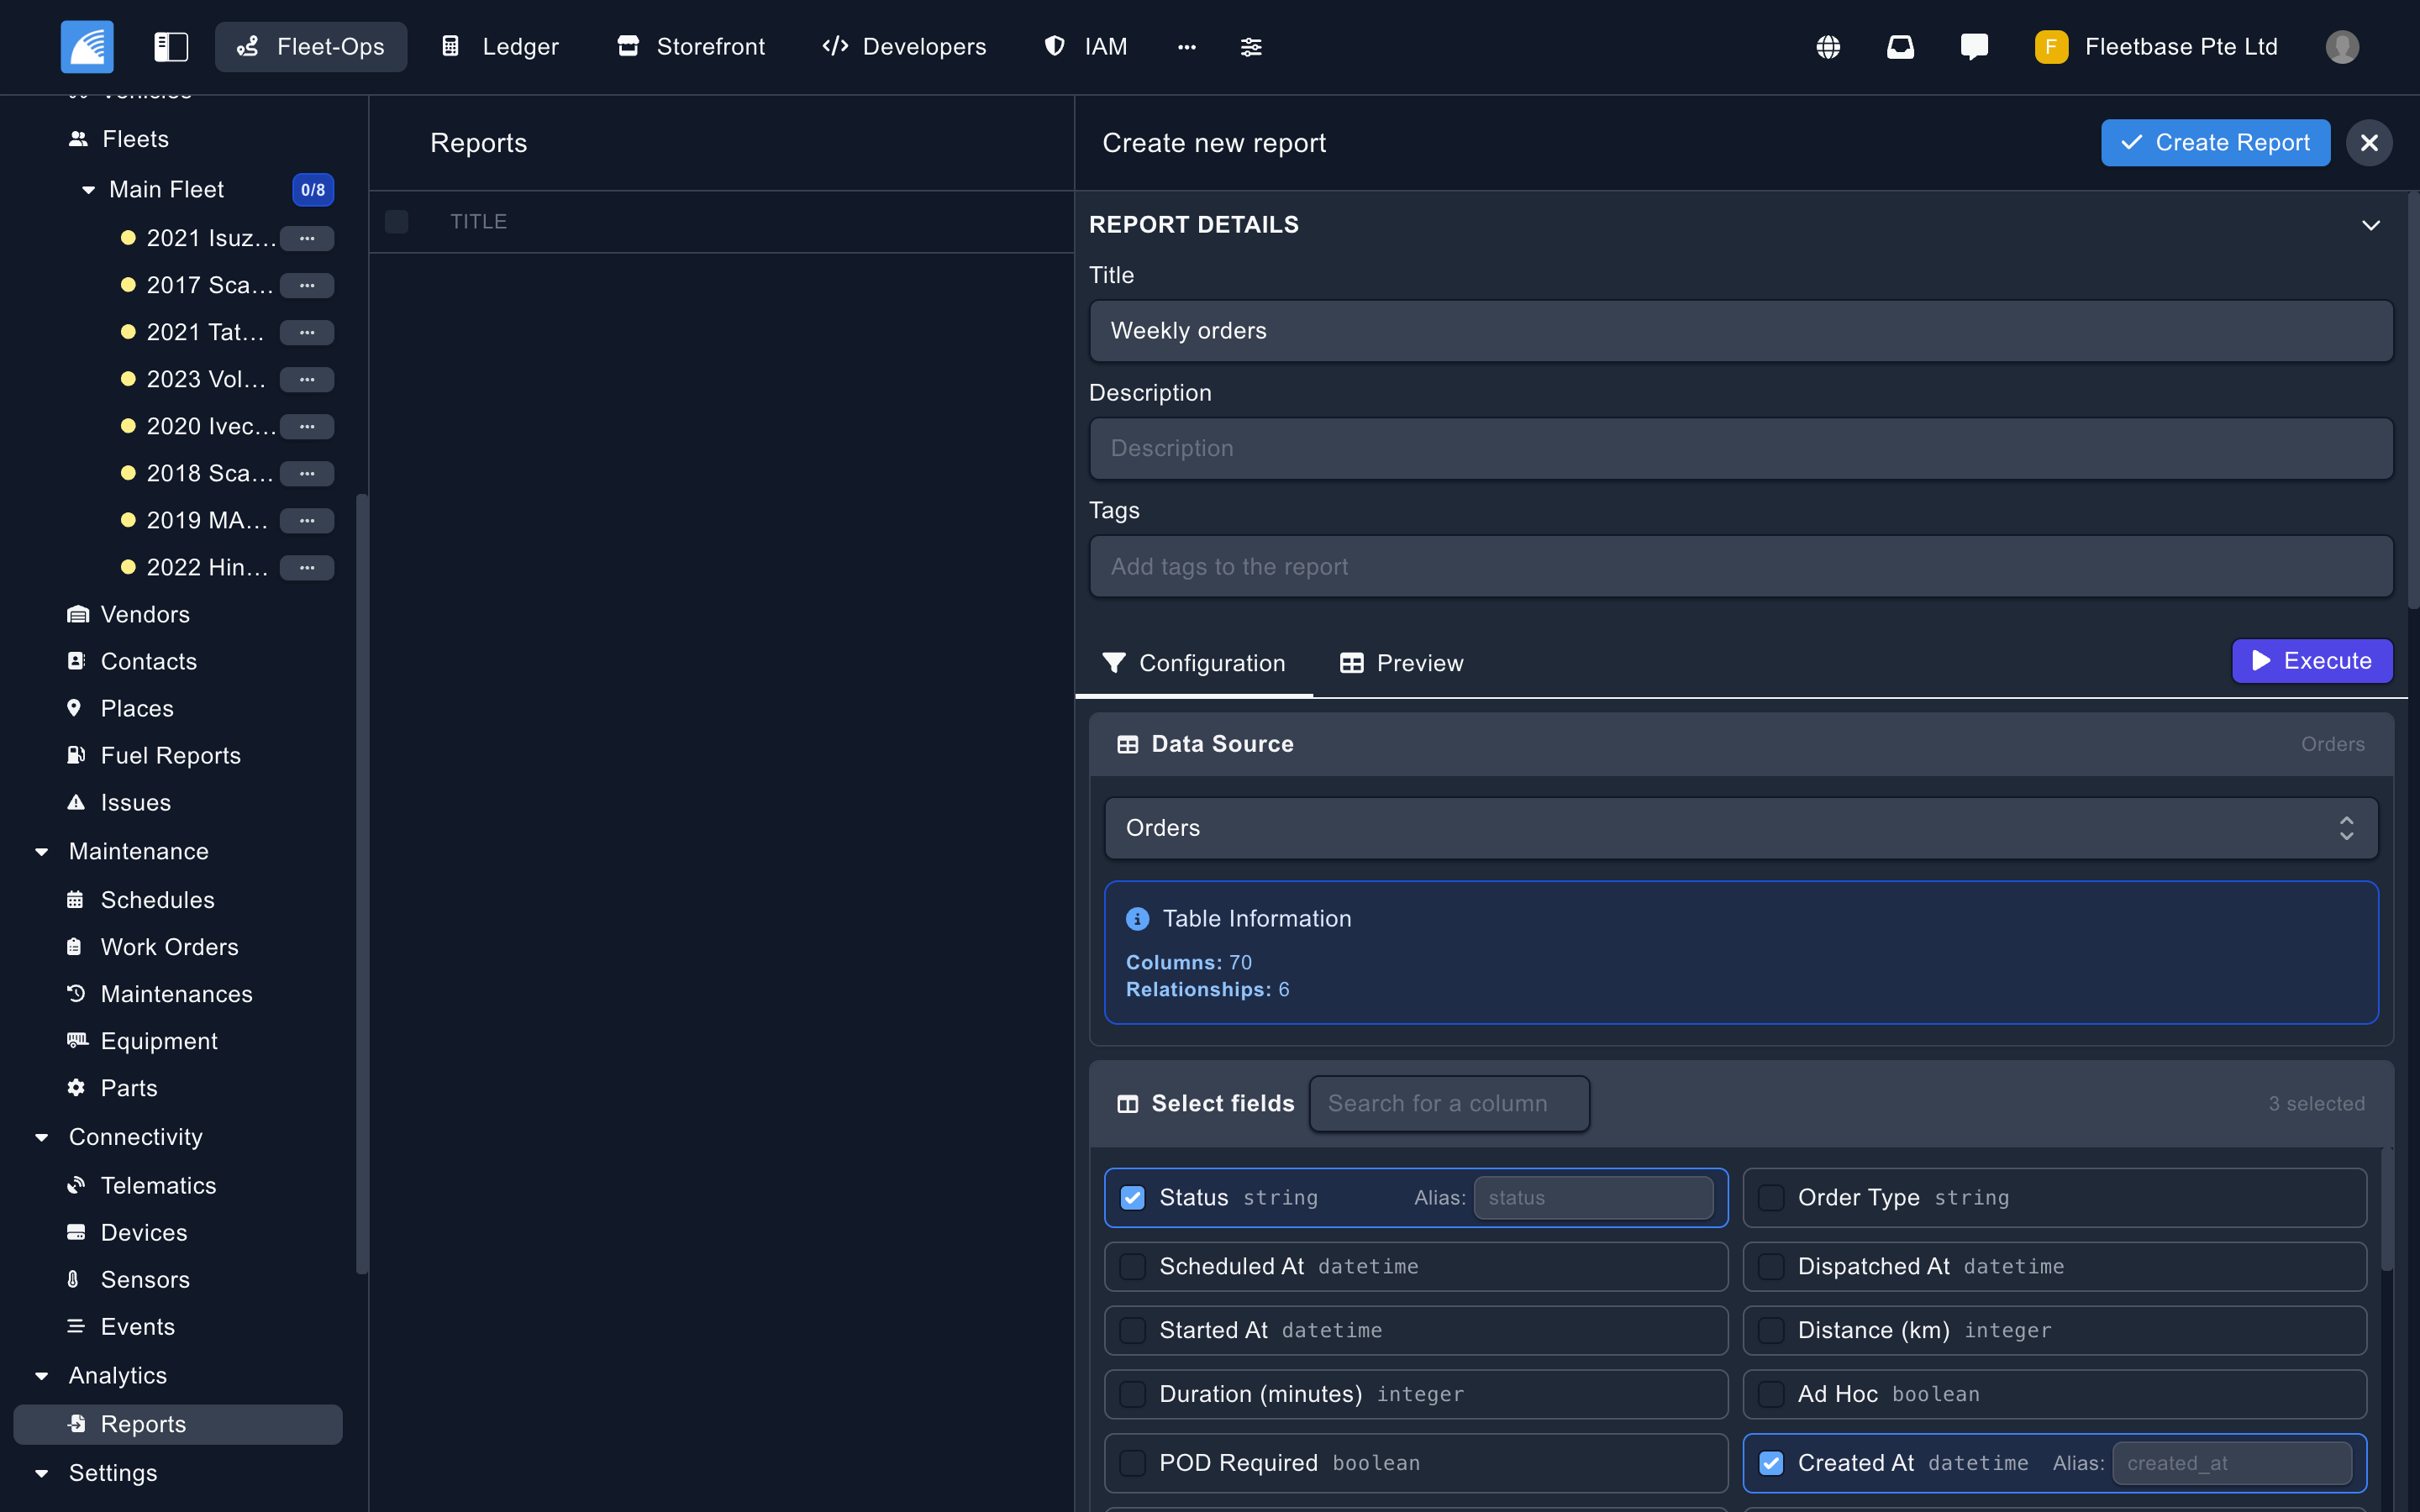
Custom Dashboards & Report Builder
Build the dashboards and reports your operation actually needs — not what came preconfigured. Drag-and-drop report builder lets operations managers, finance, and account teams each build views tailored to their role without needing a developer.
- Drag-and-drop dashboard builder with configurable widget types
- Saved report templates for recurring performance reviews
- Scheduled report delivery via email to stakeholders
More built-in, out of the box
Every feature your team needs, without the integrations tax.
“We used to spend two days every month pulling together the client SLA report. Now it's generated automatically and in their inbox on the first of the month. And because we can see performance in real time, we fix issues before they show up in the report.”
Common questions
Everything you need to know before getting started.
How current is the data in the analytics dashboards?
The live operations dashboard is updated in real-time as events occur. Historical analytics and KPI charts typically refresh on 5-minute intervals, with end-of-day summaries available by 00:30.
Can I build custom reports for different teams?
Yes. The report builder allows you to create team-specific dashboards and reports. Saved reports can be scheduled for automatic delivery via email to operations, finance, or account management teams.
Can we export data for use in external BI tools like Power BI or Tableau?
Yes. All operational data is accessible via the REST API and can be exported in CSV and JSON formats for ingestion into any external analytics or BI platform.
Does Fleetbase track fuel costs and vehicle running costs?
Yes. Fuel consumption data from telematics integration, combined with route distance and vehicle type data, enables cost-per-kilometre and cost-per-delivery calculations at vehicle and fleet level.
How far back does historical data go?
Data retention is configurable and unlimited on self-hosted deployments. Cloud plans retain full operational history with no artificial cutoff.
Make every operational decision a data-backed one
The insights you need to cut costs, meet SLAs, and grow your operation with confidence. Start your free trial and have your first performance dashboard live in minutes.
7-day free trial · Full platform access